
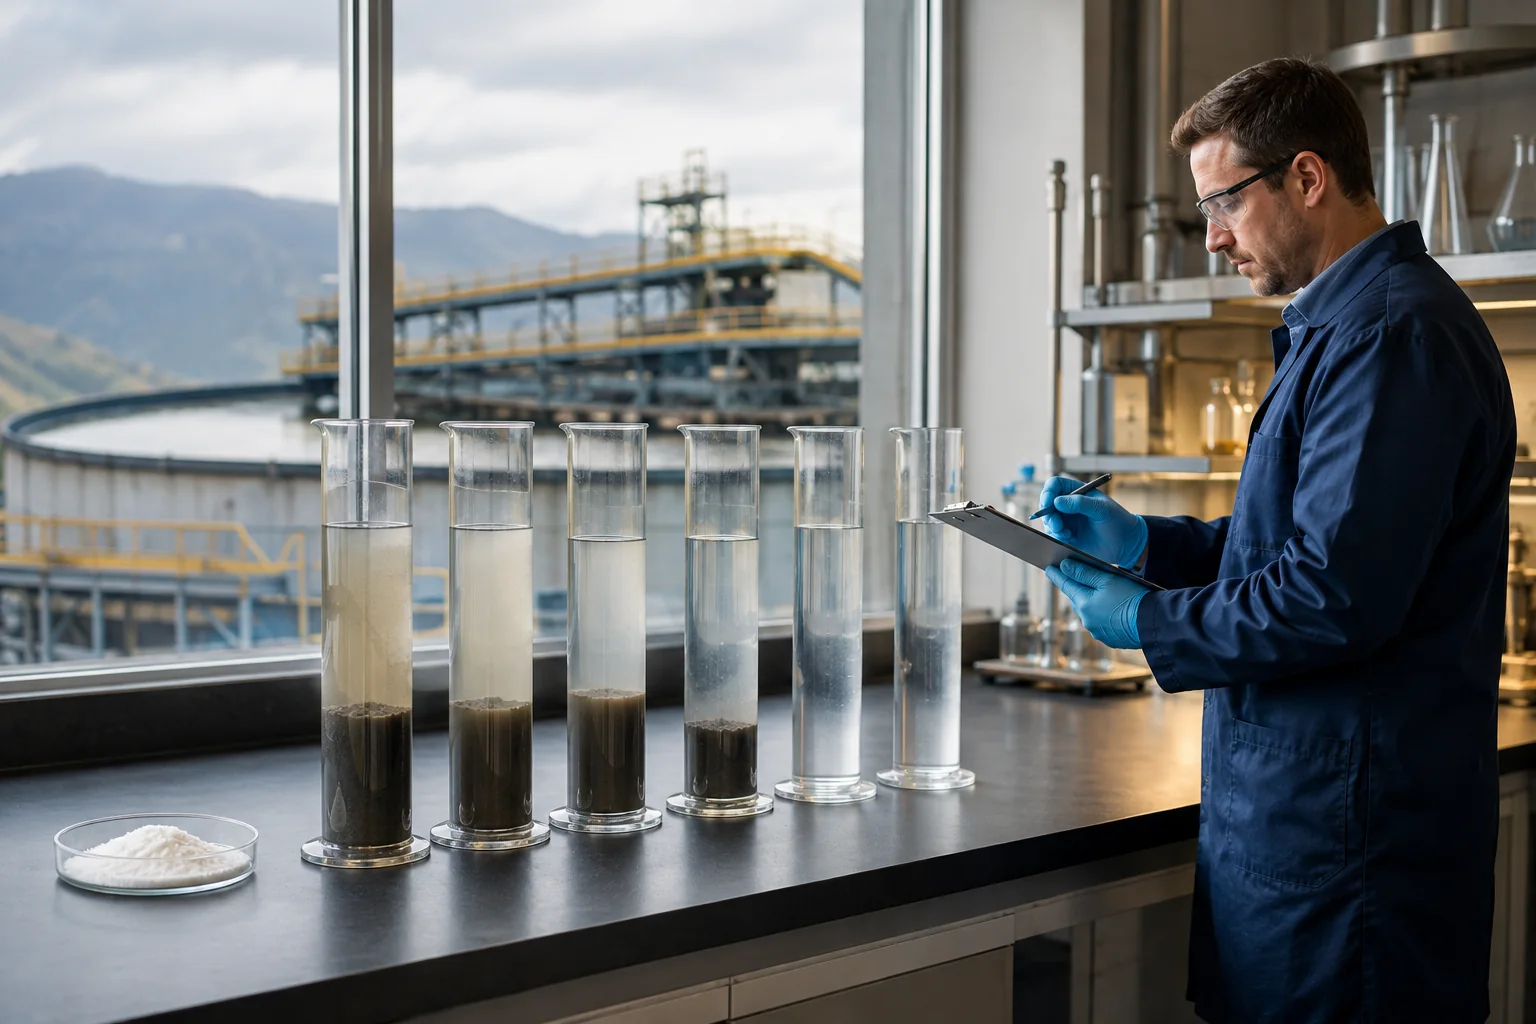
Anionic polyacrylamide dosage is a measured operating window, not a fixed value copied from another plant. Feed solids, water chemistry, upstream coagulant, product form, mixing and separator duty all change the useful dose.
Define the decision before filling jars
State whether the target is settling rate, supernatant turbidity, thickener compaction, DAF rise, filtration, cake or another endpoint. Record feed origin, sampling time, solids, pH, conductivity, temperature and upstream chemicals.
Homogenize the sample gently before splitting it. Losing settled fines or applying severe uncontrolled shear makes jars incomparable.
Prepare a known polymer stock
Record product code, lot, active fraction, powder or liquid form, preparation water, concentration, induction, mixing and age. Reject stock with visible lumps or uncertain concentration.
Calculate the active mass placed in each jar. Equal solution volume is meaningful only when stock concentration and active content are equal.
Include controls and a dose curve
Use an untreated control and, where relevant, a coagulant-only control. Screen several polymer points from clear underdose through a deliberate high point. If several products are compared, use the same compact dose set first, then refine finalists around their own response.
Repeat the best condition. One attractive jar can reflect sample split, timing or operator variation.
Reproduce chemical sequence and mixing
Apply pH correction and coagulant under the intended rapid mix, allow microfloc formation, then distribute polymer and reduce energy for growth. When APAM is used without coagulant, reproduce its actual injection and contact sequence.
Report mixer settings and times as test conditions, not universal numbers. Different apparatus produces different energy.
Measure more than appearance
Record floc formation, interface movement, supernatant turbidity or suspended solids, final sediment volume and response after a defined shear step. For filtration, run a representative drainage or pressure test. For DAF, settling jars may be the wrong primary apparatus.
Identify the first useful point, practical middle and onset of overdose. The operating target normally belongs inside that range.
Convert the result to production
Translate laboratory mass to active polymer per water volume or dry solids and state the basis. Calibrate the full-scale feeder at operating conditions. Account for actual solids flow, stock concentration and secondary dilution.
Change one variable, wait for process residence, then sample. Document equipment settings and feed condition alongside each dose.
Calculate active dose: a worked example
Active dose (mg/L) = stock active concentration (g/L) × stock added (mL) ÷ sample volume (L). The numerical conversion works because 1 g/L equals 1 mg/mL. Use the active concentration, not merely the weighed commercial product concentration.
For a calculation example only, adding 2 mL of stock containing 1 g/L active polymer to a 1 L sample gives 2 mg/L active dose. If that sample contains 10 g/L dry solids, this is 200 g active polymer per tonne of dry solids: dose (g/t) = dose (mg/L) ÷ solids (g/L) × 1000. These numbers illustrate unit conversion, not a recommended treatment dose.
For plant scale, active feed (kg/h) = dose (mg/L) × flow (m³/h) ÷ 1000. Divide active feed by the supplier-declared active mass fraction to obtain commercial product consumption. Check density separately when converting a liquid product from mass to volume.
Close the commercial comparison
Use delivered as-supplied consumption plus water recovery, throughput, sludge handling, cleaning and labor to compare cost. A cheap kilogram or low nominal dose can lose value elsewhere in the process.
Send the completed curve with the APAM trial and quotation request.
Preserve a repeatable test sheet
A complete sheet names the sample, date, operator, apparatus, product code and lot, stock concentration and age, every chemical dose, mixing sequence, settling or filtration time and measured result. Photographs can support the record but should not replace numbers.
Keep raw observations as well as the selected point. When plant performance later changes, the underdose and overdose jars provide diagnostic boundaries that a single winning result cannot show.